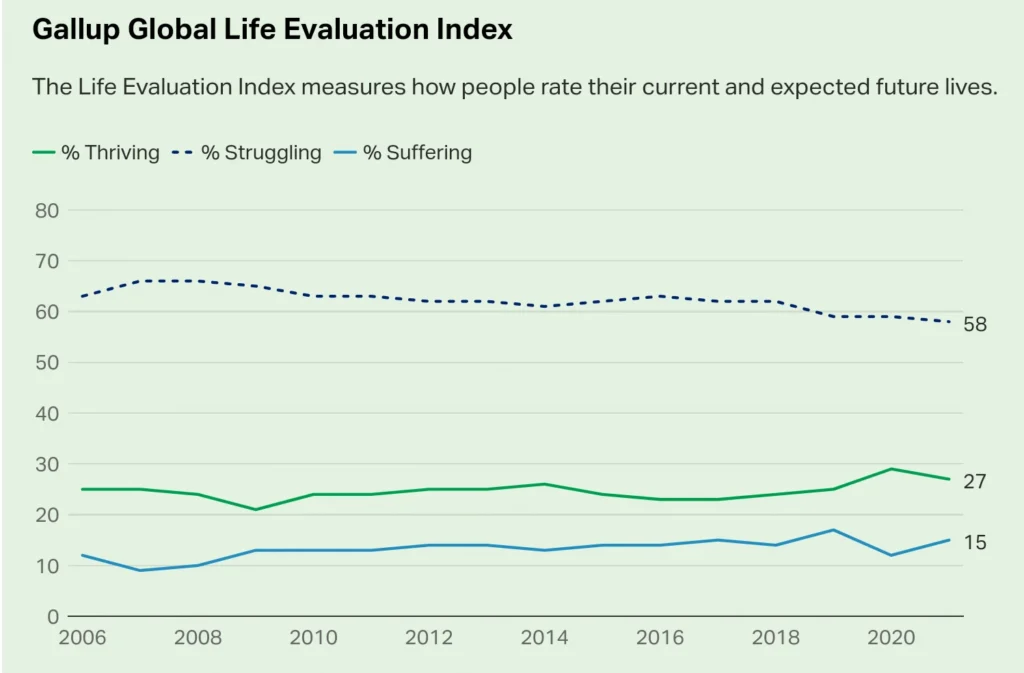
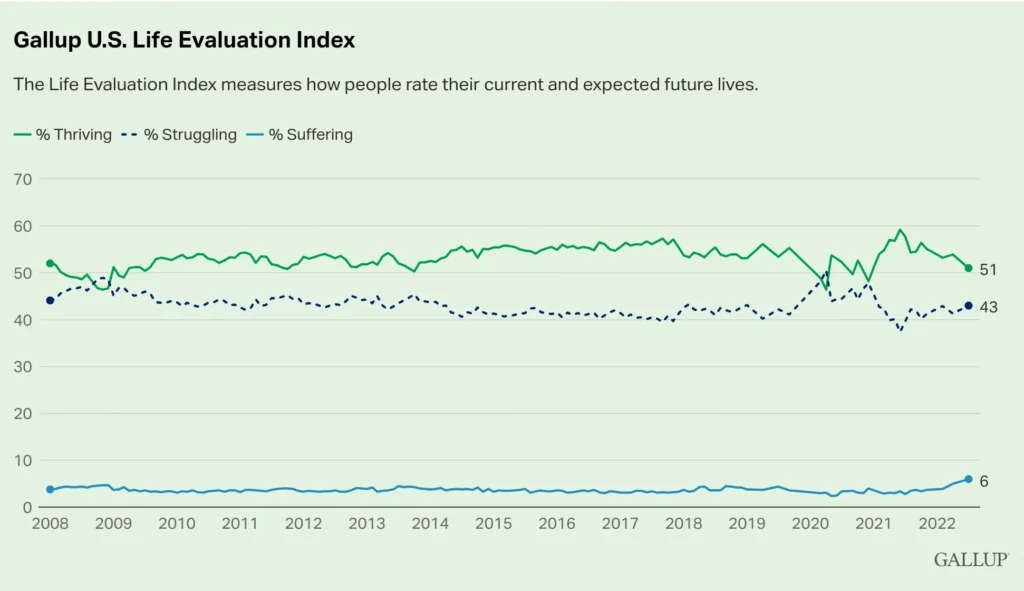
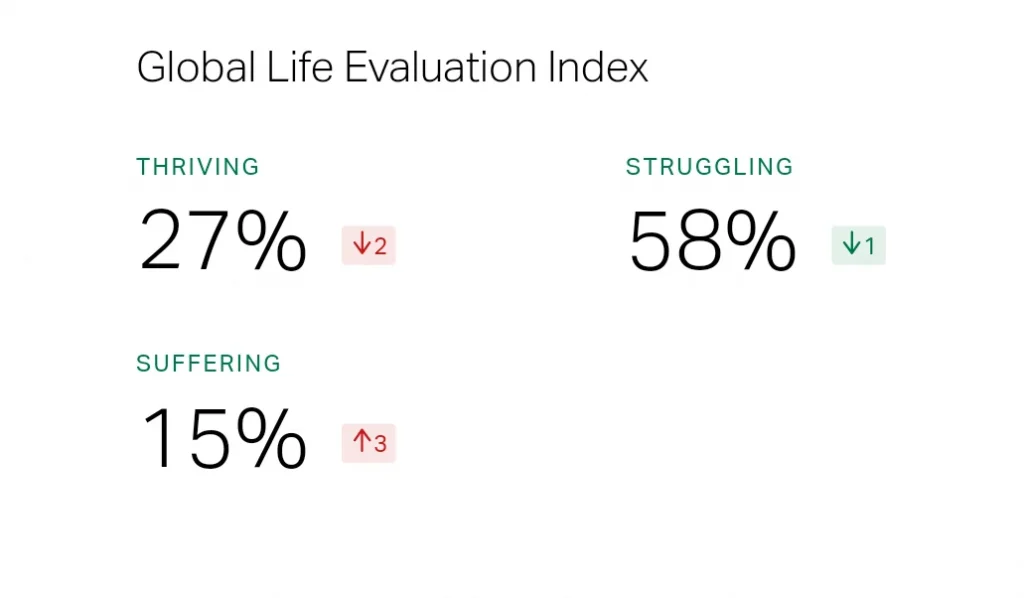
The Gallup Life Evaluation Index delves deeply into individuals’ perceptions of their own lives, offering valuable insights into wellbeing and satisfaction across various populations. It differs from the World Happiness Report (WHR) in the following aspects:
| Aspect | World Happiness Report | Life Evaluation Index |
|---|---|---|
| Publisher | United Nations Sustainable Development Solutions Network (SDSN), in partnership with the Ernesto Illy Foundation and the Gallup World Poll data. | Gallup Organization |
| Scope | Comprehensive analysis of global happiness and well-being | Specific measure of self-reported life satisfaction |
| Data Sources | Multiple sources including Gallup World Poll, GDP per capita, social support, life expectancy, freedom, generosity, and corruption perceptions | Gallup World Poll data focusing on life satisfaction |
| Focus | Broad, encompassing social, economic, and environmental factors influencing happiness | Personal perceptions of current and future well-being |
| Components | Integrates various data points for a holistic view of happiness | Single measure based on a survey question rating life on a scale of 0 to 10 |
| Purpose | To provide insights and recommendations for policymakers to improve well-being | To measure and track self-reported well-being globally |
| Publication Frequency | Annually | Continuous (part of the Gallup World Poll) |
| Country Coverage | Over 150 countries | Over 140 countries |
| Use in Policy Making | Provides policy recommendations based on comprehensive analysis | Used as a data source for broader reports like the World Happiness Report |
| Example Metrics | Happiness rankings, analysis of factors affecting happiness, regional and country-specific insights | Average life satisfaction scores, trends over time |
Table of Contents
What Is the Gallup Life Evaluation Index?
The Gallup Life Evaluation Index measures individuals’ overall life satisfaction. Participants rate their lives on a scale from 0 to 10, with 10 being the best possible life and 0 the worst. This index captures subjective wellbeing and reflects people’s perceptions of their circumstances.
Global Methodology

The 2021 life evaluation ratings are based on nationally representative samples from 116 countries, surveyed between April 2021 and January 2022. Surveys were conducted via telephone or face-to-face interviews. The margin of sampling error ranges from ±2.8 to ±5.0 percentage points at the 95% confidence level, accounting for data weighting, question wording, and practical survey challenges.
U.S. Methodology

Results from the most recent U.S. survey, conducted in February 2022, are based on responses from 2,837 adults. The margin of sampling error is about ±2.3 percentage points at the 95% confidence level. Samples from 2020 to 2022 included between 2,500 and 4,000 respondents each month. Previous years featured larger samples, with varying proportions of cellphone and landline respondents, ensuring a representative cross-section of the population.
Key Findings in 2023: A Slight Dip

In 2023, 52.1% of U.S. adults rated their lives well enough to be considered “thriving,” marking a three-point decline from previous norms (2015-2019 and 2021). This slight decrease suggests potential influences affecting overall life satisfaction.
Factors Influencing Life Satisfaction
The Gallup Life Evaluation Index is influenced by a variety of factors that shape people’s perceptions of their current and future well-being. These factors include:
Economic Conditions
- Income: Higher income levels generally correlate with higher life evaluation scores.
- Employment: Job security and quality of employment also play significant roles in well-being.
Health
- Physical Health: Good physical health and access to healthcare services positively influence life evaluations.
- Mental Health: Mental health is a critical component, with better mental health leading to higher life satisfaction.
Social Factors
- Social Support: Having strong social support networks, including family and friends, boosts life satisfaction.
- Community: Feeling a sense of belonging and trust within one’s community enhances well-being.
Personal Freedoms
- Autonomy: The ability to make personal choices and have control over one’s life is crucial for higher life evaluations.
- Freedom from Corruption: Lower levels of corruption contribute to higher satisfaction as they promote fairness and trust in institutions.
Safety and Security
- Physical Safety: Living in a safe environment free from violence and crime positively affects life evaluations.
- Economic Security: Stability in financial matters and the absence of economic stressors contribute to better well-being.
Quality of Life
- Housing: Quality of housing and living conditions are important for overall satisfaction.
- Environment: Clean and sustainable environments contribute to better life evaluations.
Education
- Access to Education: Higher levels of education are associated with better life evaluations due to improved opportunities and personal development.
Cultural and Societal Norms
- Cultural Values: Societal norms and cultural values also play roles in shaping individuals’ perceptions of their lives.
Top World Happiness Report Performers
The World Happiness Report is an annual publication by the United Nations Sustainable Development Solutions Network. It ranks global happiness based on factors like GDP per capita, social support, life expectancy, freedom, generosity, and corruption, using data from the Gallup World Poll and other sources.
Top 10 Countries
- Finland
- Denmark
- Switzerland
- Iceland
- Netherlands
- Norway
- Sweden
- Luxembourg
- New Zealand
- Austria
Bottom 10 Countries
- Afghanistan
- Lebanon
- Zimbabwe
- Rwanda
- Botswana
- Lesotho
- Sierra Leone
- Tanzania
- Malawi
- Haiti
